QCarbon
Automated Raman D-to-G peak intensity ratio analysis for carbon materials
Raman spectroscopy is a powerful tool for characterizing carbon materials. It helps in analyzing the structural properties and composition of various carbon forms. The D and G peaks are significant in Raman spectroscopy for carbon materials. The D peak signifies structural defects, while the G peak corresponds to the graphitic structure. The ID/IG ratio often indicates the degree of disorder or defects in the carbon structure.
For research and quality control testing, your Raman spectral data are analyzed in one click using D and G peak intensity ratio. Statistics are displayed in your QCarbon dashboard for an overview at a glance in LabSpec 6 and a customized report is automatically generated for easy interpretation and sharing of the obtained data.
This application software associated with ��������ֱ�� Raman microscopes can be valuable in scientific research and industrial applications. Analyzing the structure, graphitization, impurity defects, coating uniformity, and other indicators through Raman spectroscopy can provide crucial insights into the quality and characteristics of different carbon materials.
Request today for a demo and/or trial version to discover the power of QCarbon and automatize the quality and characteristic analysis of your different carbon materials.
- One-click data processing, no more complicated operations
- At-a-glance analysis and statistics, panoramic data display
- Customized report export, suitable for quality control process
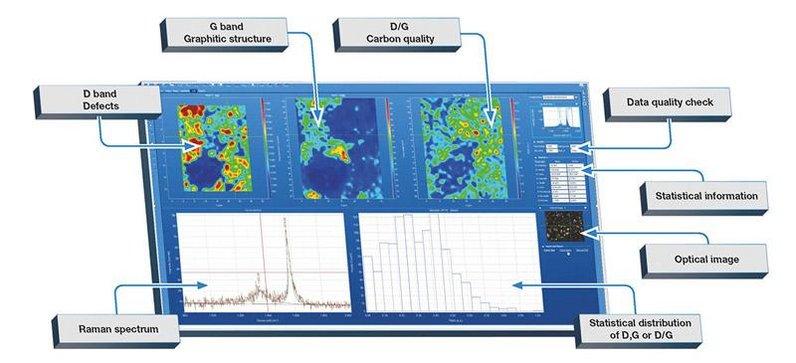
Figure 1: QCarbon facilitates Raman analysis for carbon materials, especially with its ability to automatically process Raman spectral data and giving the ID/IG ratio.
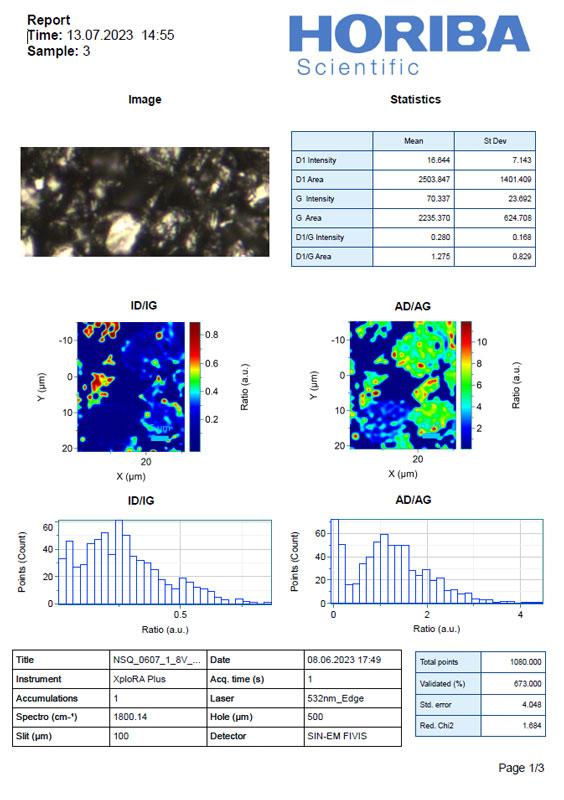
Figure 2: QCarbon exports statistics and fitting results in a customized report.